A process map you edit as text
Process mapping means drawing how work really moves: who does each step, in what order, where decisions are made and where work bounces back. A good process map is the starting point for fixing a slow process, writing a procedure or training someone new.
This template is a typical as-is map of an order process. Each lane belongs to one role, so you can see every hand-off between teams at a glance – hand-offs are where delays and mistakes usually happen. The diamond asks one question (In stock?) and the No answer loops back to the customer, which is exactly the kind of rework a process map should make visible.
The map is a few lines of text, so changing a step is changing a word, and the layout redraws itself. It runs in your browser: nothing is uploaded, there is no account, and your text stays on this device.
We tested it (1 Nov 2026)
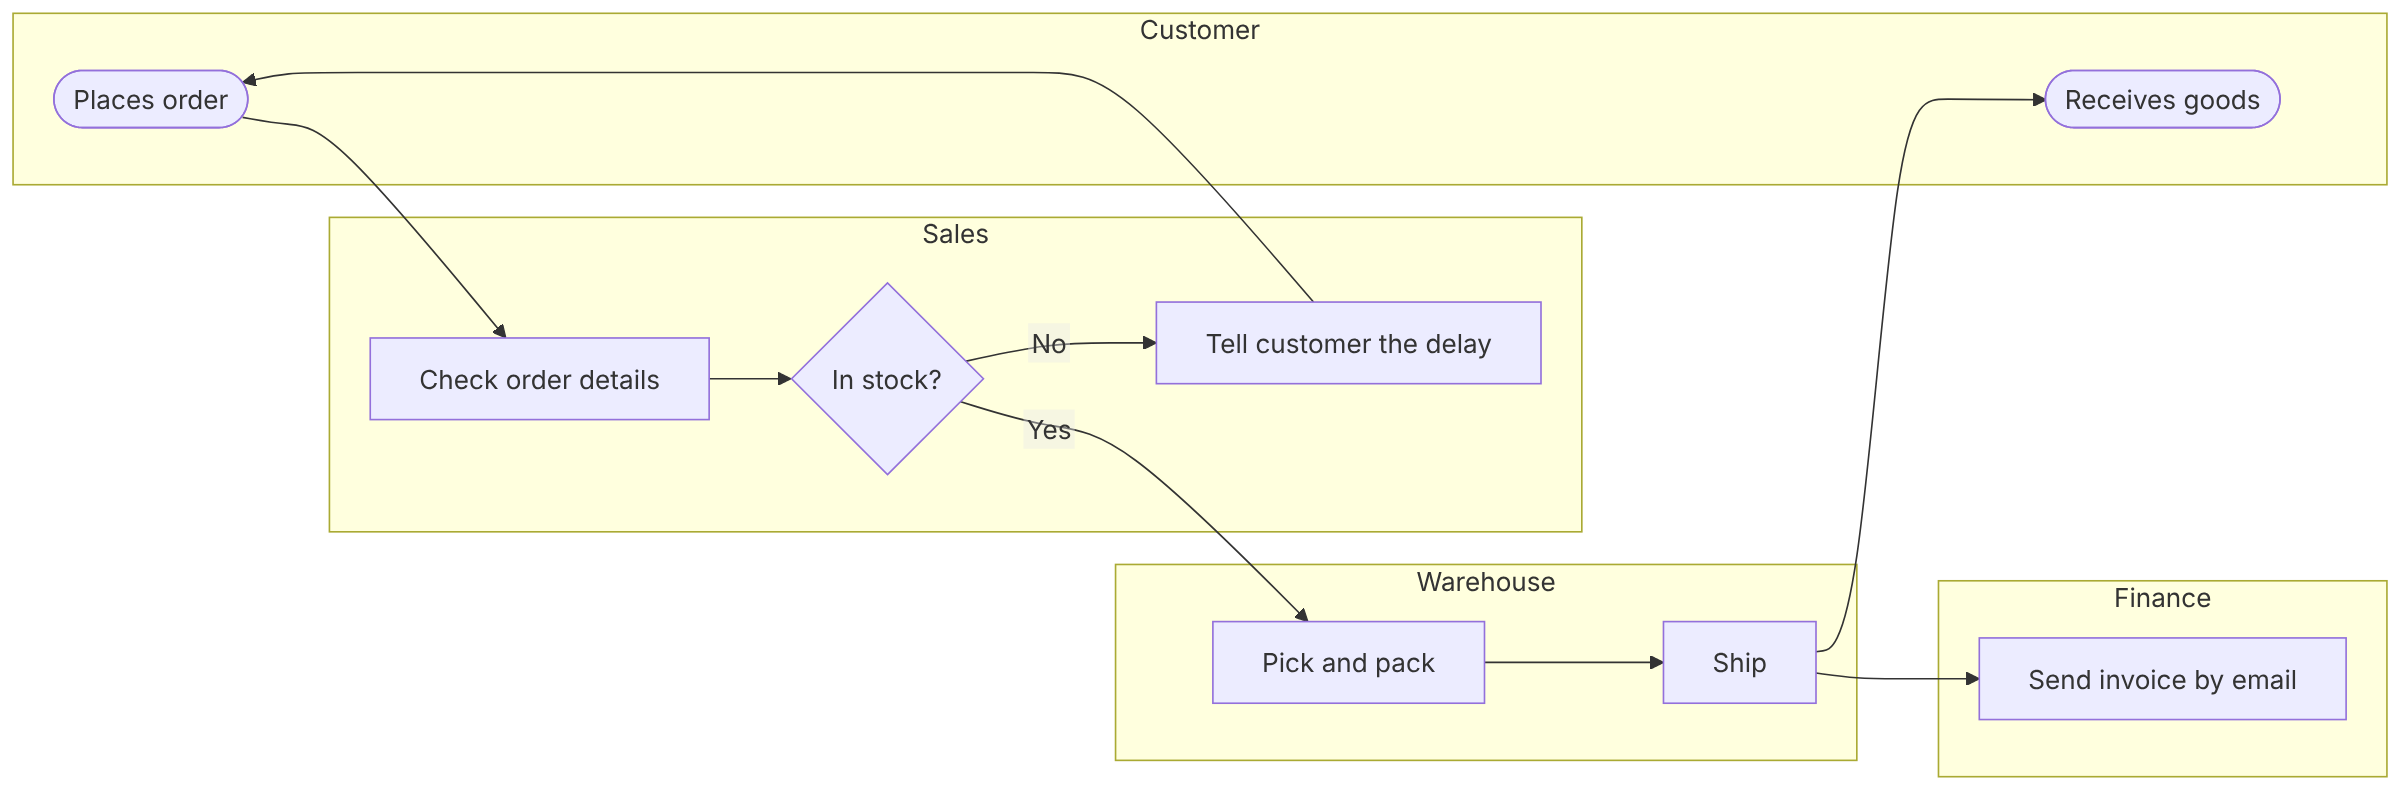
On 1 November 2026 we opened this page in a desktop browser, changed one step from Send invoice to Send invoice by email and pressed Download PNG. The file (process-mapping-template.png, 2400 × 790 px) shows all four lanes, the In stock? decision with both answers labelled and the No loop back to Places order.
Our read: the hand-offs between lanes are easy to follow, which is the point of a process map. Two things to know: the lanes are not equal-width rows like in a drawing tool – each lane box is placed where its steps fall in the flow, so Finance sits to the right of Warehouse – and a long left-to-right map gets small on a phone screen. For a phone or a narrow document, change the first line to flowchart TB to stack the map top to bottom.
On a phone
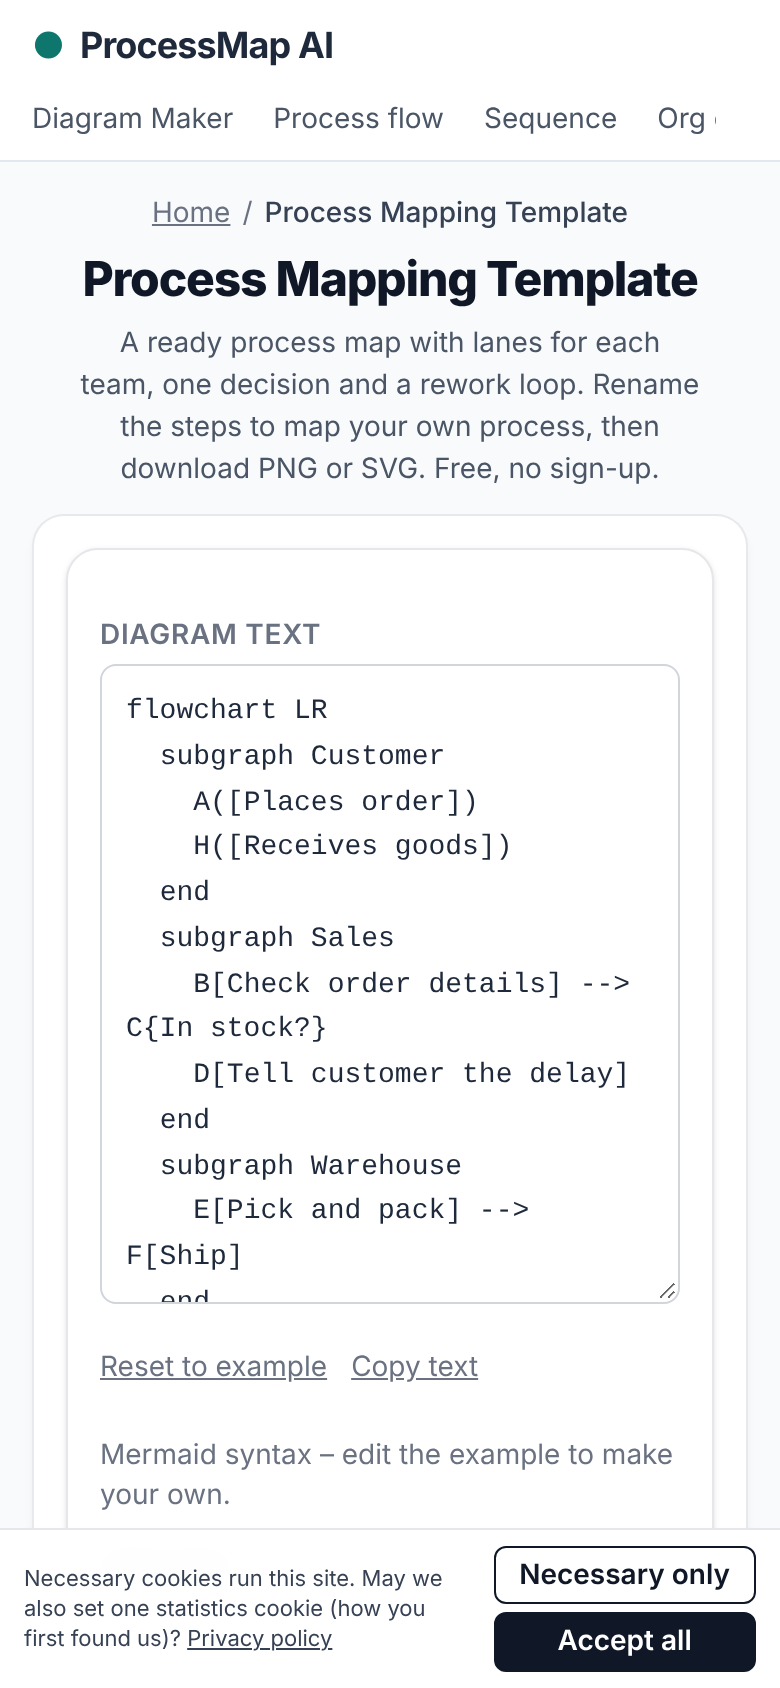
The same day on a 390 px wide phone screen: the page fits without sideways scrolling, the diagram text opens first and the map preview and download buttons follow below it.
How to use this process mapping template
- Pick one process with a clear start and end, such as 'customer places order' to 'customer receives goods'.
- List the roles involved and rename the four lanes (subgraph lines) to match. Add a lane by copying a subgraph block.
- Walk through the process as it happens today, not as it should happen, and write one box per step: a verb and an object, like Check order details.
- Mark every decision with a diamond and label both exits.
- Draw the loops: wherever work is sent back, add an arrow back to the earlier step.
- Download the map and review it with the people who do the work – they will spot missing steps faster than anyone.
As-is and to-be maps
Start with an as-is map of the current process, including the workarounds. Once everyone agrees it is accurate, copy the text and edit the copy into a to-be map: remove steps that add no value, merge hand-offs, move decisions earlier. Keeping both versions side by side makes the improvement easy to explain in a meeting or a report.
Symbols used in the template
Rounded boxes are the start and end of the process. Rectangles are steps. Diamonds are yes-or-no decisions. Arrows show the order, and a label on an arrow names the answer it stands for. Lanes (the boxes with a title) show who owns each step. These are the same basic symbols most process mapping guides use, so the map will read correctly for anyone used to flowcharts.
Related templates and diagrams
If you only need the steps without roles, a process flow diagram is quicker. If the roles matter most, the swimlane diagram page explains lanes in more detail. For the causes of a problem rather than the flow of work, use a fishbone diagram; for who is responsible for each task, a RACI chart.
Frequently asked questions
- Is this process mapping template free?
- Yes. It is free, has no watermark and needs no account. It runs in your browser.
- Can I add more lanes or steps?
- Yes. Copy a subgraph block to add a lane, and add a line such as E --> X[New step] to add a step. The map redraws as you type.
- Can I use the map in Word, PowerPoint or Google Docs?
- Yes. Download the PNG and insert it as a picture, or download the SVG, which stays sharp at any size in recent versions of Office.
- What is the difference between a process map and a flowchart?
- A flowchart shows the order of steps and decisions. A process map usually adds who does each step – often as lanes – and is used to analyse and improve a process. This template does both.
- Is my process saved?
- Your text is kept in this browser on this device so you can come back to it. Nothing is uploaded to us.